
Nathan Forrester
from The Life Cycle of Economic Development, Wright-Allen Press, Inc. 1973
Introduction
1.1 Overview
This book presents a system dynamics model of the life cycle of national economic development. The life cycle of economic development, occuring in the span of a few hundred years, can be divided into the phases of growth, transition, and equilibrium. During the growth phase, population, production, and industrialization increase exponentially. During the transition phase, economic growth encounters mounting negative pressure from physical and social limits to growth. During the equilibrium phase, the forces producing and restraining growth are in balance. The model deals with a 250-year period of the development life cycle and focuses on changes occuring during the 100-year transition phase between growth and equilibrium. (1)
The model deals with the shifting allocation of labor and capital between major production sectors to balance the needs of the population during the life cycle of development. Within each sector, capital accumulation is controlled by the relative marginal productivities of capital and labor. Chapter 1 provides an introduction to the model structure and a preview of the model behavior. Chapter 2 examines the structure of the model in more detail. Chapter 3 analyzes three different life-cycle modes generated by the model. Chapter 4 examines the effects of four different development strategies on a single life-cycle mode. Chapter 5 presents observations on the model's behavior and examines the use of system dynamics in policy planning. The appendices present the details of the formal computer model used in this study. (1)
1.2 Introduction to Model Structure
In the model, economic activity is divided into five production sectors- agriculture, goods, services, capital, and resources. Each sector has a functional niche in the economy, and the sectors fit together in a structural network. (1)
Figure 1 - 1 illustrates the material flows between sectors. The five production sectors are linked together through the population. All production sectors support the flow of food, goods, and services to the population while the population supplies labor to all five sectors. (2)
Figure 1 -1 shows that the agricultural sector produces food. The agricultural sector uses labor, capital, and land as inputs to food production. The activities of the agricultural sector include farming, fishing, food processing, and the production of short-life goods used in food production like fertilizers, pesticides, and seeds. The labor in agriculture includes all people working in connection with activities of the agricultural sector. The capital in agriculture includes not only farm machinery, fertilizers, factories, buildings, and land improvements, but also investment in knowledge of production techniques. Capital has an average lifetime of about 25 years. The fertility and distribution of land in combination with the climate determine the quantity of food that can be produced by a given amount of labor and capital in agriculture. (2)
The goods sector produces durable goods that are used or operated by the consumer public. The goods sector uses labor, capital, and processed resources to produce goods. The activities of the goods sector include production of housing, cars, clothing, and recreational facilities. Consumer goods have an average lifetime of between five and ten years. The processed resources input to the goods sector includes wood, plastics, cement, metals, and energy. (2)
Figure 1-1 shows that the services sector produces services for the population. The services sector uses direct labor and capital as production inputs. The services sector is assumed to have no resource input except indirectly through the resources in its capital. The activities in the services sector include work in health, government, education, arts, banking, transportation, communication, hotels, and restaurants as well as repairs and personal services. Business services are considered part of the activity in the appropriate production sector. Services are nonphysical and therefore have no lifetime. (3)
The capital sector produces capital for all five production sectors including itself. The capital sector uses labor, capital, and processed resources as production inputs. The activities in the capital sector include research and development, manufacture of machinery, professional training, and construction of productive structures such as factories, roads, and dams. Both knowledge of productive techniques and capital goods are classified as capital in the model. Capital is any form of output with a long lifetime that is used as an input to production. The average lifetime of capital is approximately 25 years. (3)
The resources sector produces processed resources for the goods and capital sectors. The resources sector uses labor, capital, and natural resources as production inputs. The activities in the resources sector include production of metal, chemicals, plastics, building materials, oil, and energy. The natural resources tapped by the resources sector are the nonrenewable inputs from nature. (3)
The circular structure of the model is evident from Figure 1-1. The two secondary sectors-capital and resources-support the consumer sectors. Output from the three consumer sectors-food, goods, and services-supports the population. Labor from population supports all five production sectors. The only factors of production that lie outside the circular flow pattern are the environmental production inputs-natural resources and land. (3)
Figure 1-1 should be used for reference and orientation while reading about the structures that control dynamic behavior in Chapter 2 and Appendix A. (3)
1.3 Preview of Model Behavior
The model generates several different life-cycle behavior modes. These modes are discussed in Chapter 3. Figure 1-2 illustrates one possible life-cycle mode of development for the Canadian economy over a 250-year period. The figure begins in 1900 during the growth phase. The growth continues until about the year 2000. The transition of the life-cycle begins in about 2000 and continues through 2100. The equilibrium phase begins in 2100 and continues beyond 2150. (3)
The curves plotted in Figure 1-2 show the behaviors of several model variables. Population grows exponentially during the growth phase and into the transition phase. By approximately 2075 in the transition phase, population growth begins to slow. By 2150 in the equilibrium phase population growth has nearly ceased. The end of population growth is produced in the model by overcrowding. As population density increases, the birth rate slowly falls until it equals the death rate and population growth stops. (3, 4)
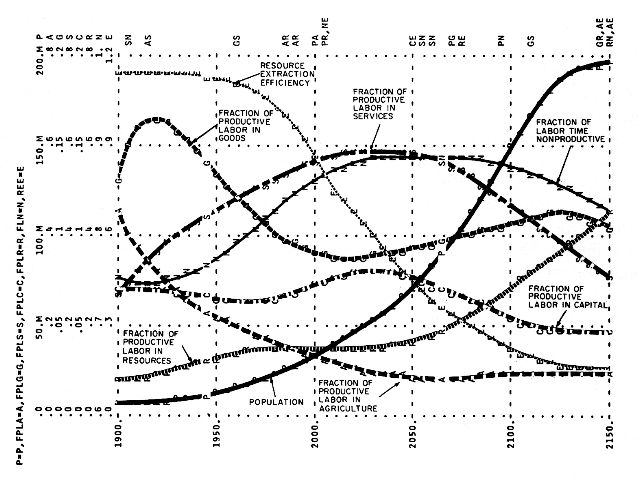
As shown in Figure 1-2, the allocation of labor between sectors shifts during the development life-cycle. During the growth phase, until 2000, the fraction of productive labor in agriculture declines and the fraction of productive labor in services rises. The reallocation of labor from agriculture to services occurs because capital accumulation raises productivity in the agriculture sector, releasing labor to satisfy the lower priority need for services. During the transition phase, the fraction of productive labor in the capital sector peaks and falls. Labor is reallocated away from the capital sector because of declining demand for capital produced by increase in the cost of capital. The cost of capital increases due to increase in the cost of resources. The cost of resources rises because resource extraction efficiency declines. During the equilibrium phase, labor is reallocated to the resources sector to compensate for the loss of extraction efficiency. Resource extraction efficiency falls sharply during the transition phase, due to accelerating depletion of high grade, easily accessible resources as the economy grows and becomes more prosperous. (4)
The fraction of labor time nonproductive (a measure of the amount of leisure time available) rises during the growth phase, peaks during the transition, and declines in the equilibrium phase. The fraction of labor time nonproductive declines because labor is reallocated to the resources sector. (5)
Figure 1-2 simply illustrates the type of behavior generated by the model: the underlying causes of changes are explained more fully in Chapter 5. (5)
The model behavior is produced by the individual causal relationships between model variables. The following chapter examines some of the important causal loops in the model. (5)
Note on copyrights: Many of the texts shown in my references are hidden in the basement of the University of Oklahoma Library in a section referred to as "the old stacks". The authors of these books - giants among scholars - are now deceased, and I doubt that their old ghosts would mind in the least having some selections of their life's works available to the web.
Others, as in the above example, are more recent. Their author is presumably still breathing, and the publisher is an ongoing concern. It is possible that - in a world where even the exchange of ideas is a commodity market - I could be in deep doo doo if I make these too freely available.
Therefore, I present an introduction. If you find yourself particularly drawn to this text you may try to find the publisher, Wright-Allen Press, Inc @ 238 Main Street, Cambridge, MA 02142, USA. If you do, in fact, make such an enquiry and find that the publisher is no longer publishing this text. Please, let me know and I will take on the task for the reader.